>>Return to Tell Me About Statistics!
We explain the odds ratio in logistic regression analysis. Odds are calculated from the regression coefficients of the regression formula.
The regression formula obtained in the previous example is shown below.
[Figure 1]
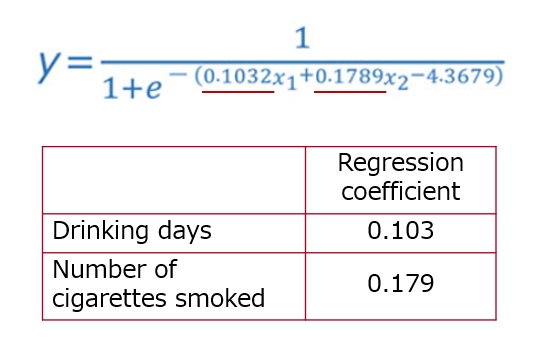
The regression coefficient represents the degree of influence on the objective variable when a variable changes by 1, and the larger the value, the greater the influence on the objective variable. However, as in this case, if the data units are different, such as the number of drinking days and number of cigarettes smoked, the variables cannot be compared.
The value obtained by converting the regression coefficient is called the “adjusted odds ratio.” The basic odds ratios of the statistics and results differ (vol. 11 reference).
Odds are numerical values used in gambling such as horse racing and are defined as “Probability P that a certain event will occur/Probability P that a certain event will not occur.”
It is similar to percentage, but there are differences in the following points.
【ratio】
Percentage = any number/total: (0 to 1)
Example: 25 people with cancer/100 people, that is, the total number of people surveyed = 0.25
【Odds】
Odds = Probability of happening/Probability of not happening: (0 to ∞)
Example: Probability that cancer will occur 0.25/Probability that cancer will not occur 0.75 = 0.333
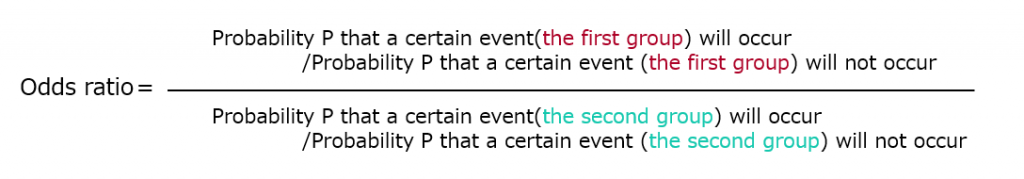
The measure used to compare two odds is the “odds ratio,” which is the basis of statistics.
[Figure 2]
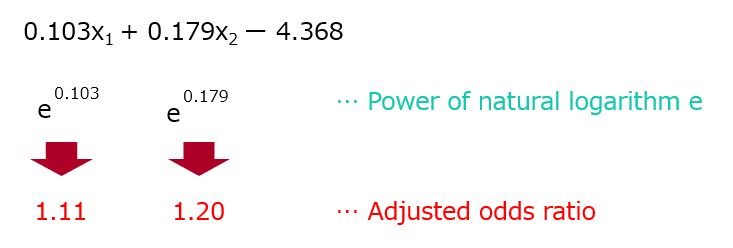
The adjusted odds ratio is determined by logistic regression, and the results differ from the basic odds ratio in statistics. Odds ratios are applied to two-group data; adjusted odds ratios are applied to quantitative data, and become numbers that the regression coefficients are converted.
The adjusted odds ratio represents the odds ratio if the value of the explanatory variable increases by one.
[Figure 3]
If the odds ratio is greater than 1, the event is more likely to occur in the first group, and if it is less than 1, it is more likely to occur in the second group.
[Figure 4]
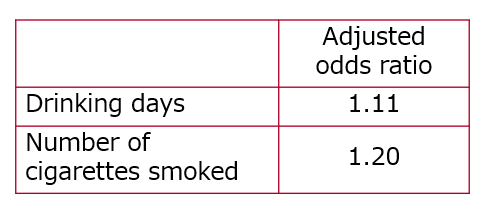
In this case, the odds ratios for the number of drinking days and the number of cigarettes smoked are greater than 1, indicating that the more alcohol consumed and the higher the number of cigarettes smoked, the more likely it is for cancer to occur.
Note that odds ratios cannot be compared if the data are in different units. The odds ratio for the number of drinking days is 1.11, and that for the number of cigarettes smoked is 1.20; therefore, it cannot be said that the number of drinking days has a lower influence on cancer.
>>Return to Tell Me About Statistics!

Comments are closed