>>Return to Tell Me About Statistics!
In this section, we describe this distribution. This mountain graph is used when examining the results of various tests in terms of deviation values.
“t distribution” is a distribution used for statistical estimation and statistical tests, and the shape of the distribution is very similar to the z distribution.
The t-distribution was introduced by William Seeley Gossett in 1908. There seem to be various theories, but at the time, he was working at a beer brewing company. The company forbade the publication of employee papers; hence, he published his papers under the pseudonym “Student.” For this reason, the t-distribution came to be called the “Student’s t-distribution.”
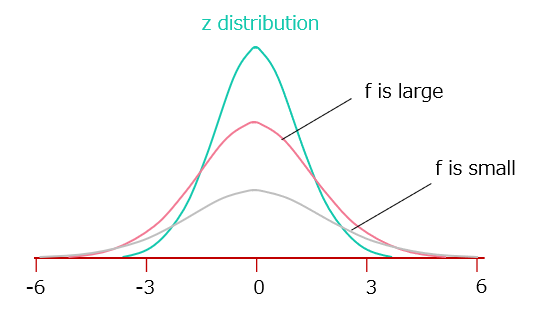
The shape of the t-distribution graph depends on the parameter f (degree of freedom). When f is sufficiently large, it matches the z distribution (standard normal distribution). However, as f becomes smaller, the distribution becomes more gradual and wider than the z distribution (Figure 1).
[Figure1]
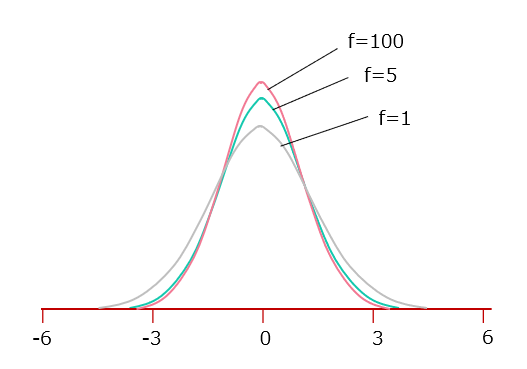
Note that the degree of freedom f depends on the sample size of the sample survey. The method for determining f differs depending on the estimation and test formula. The t distribution with degrees of freedom f = 1, f = 5, and f = 100 is shown in Figure 2.
[Figure2]
The number of data items that can take any value is called degrees of freedom. For example, if the sample mean calculated from data with a sample size of 3 is 5, the first and second values can be taken freely. Given 3 and 4, the third value must have a sample mean of 5, so it can only be “8.”
(3+4+x)÷3=5
x=8
In other words, the number of data items that can take any value is reduced by one, and the degree of freedom f is now two. The degree of freedom f for calculating the sample mean is the sample size n minus 1.
Degree of freedom f=n-1
There are two types of variance: sample variance and population variance.
[Formula]
Sample fraction: (observed data – sample mean) 2÷(n-1)
Sum the individual values found.
Population variance: (observed data – population mean) 2÷n
Sum the individual values found.
The sample mean varies because of survey errors, whereas the population mean does not. The denominator of the sample variance is degrees of freedom n-1, and the denominator of the population variance is n without considering the degrees of freedom.
>>Return to Tell Me About Statistics!

Comments are closed