>>Return to Tell Me About Statistics!
We now explain how to calculate the area (probability) of the t-distribution, which is used for statistical estimation and testing.
The upper probability of a value greater than or equal to the value x on the horizontal axis in a t-distribution with f degrees of freedom can be determined using an Excel function.
= TDIST(x, f, 1)
* 1 is the upper probability and 2 is the two-sided probability.
*The random variable x must be a value greater than or equal to 0, and negative values cannot be specified.
Calculation of t distribution (part 1)
Let us find the probability of the interval -0.5 to 0.5 in the t distribution with f = 8 degrees of freedom.
[Figure 1]
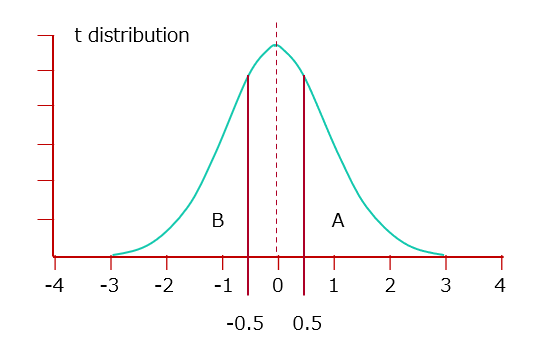
The probability of x = 0 to 0.5 is the difference between the upper probability of x = 0 and the upper probability of x = 0.5; thus, we find each value.
The upper probability of x=0 is 0.5000 (=TDIST(0,8,1)).
The upper probability of x=0.5 is 0.3153 (=TDIST(0.5,8,1)).
Therefore, the probability of x=0 to 0.5 is 0.5000-0.3153=0.1847.
The lower probability of x = −0.5 or less (Figure 1- B) is determined from the upper probability of x = 0.5 or higher, taking advantage of the fact that the t distribution is symmetrical with respect to x = 0.
The lower probability of x=-0.5 is 0.3153 (=TDIST(-0.5,8,1)).
Therefore, the lower probability of x=−0.5 to 0 is 0.5000−0.3153=0.1847.
The probability of the interval -0.5 to 0.5 in the t distribution with f = 8 degrees of freedom is 0.1847 + 0.1847 = 0.369.
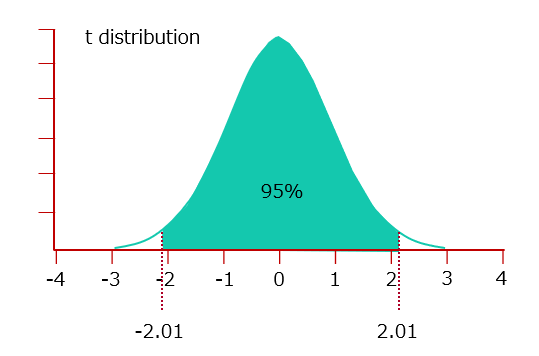
Calculating the t distribution (part 2)
Let us find the probability that the value on the horizontal axis will be between -2.01 and 2.01 in the t distribution with f = 50 degrees of freedom. (Figure 2)
The upper probability of x=2.01 is 0.025 (=TDIST(2.01,50,1)).
The lower probability of x=-2.01 is 0.025 (=TDIST(2.01,50,1)).
From the above, the probability of the interval -2.01 to 2.01 in the t distribution with f = 50 degrees of freedom is 1 – 0.025 – 0.025 = 0.95.
The result is 95%.
[Figure 2]
The value of the horizontal axis at the upper probability of the t distribution
In a t-distribution with f degrees of freedom, the value on the horizontal axis x for the upper probability p can be determined using an Excel function.
= TINV (2 times the probability p, f)
* The TINV function calculates the x value of two-sided probability. When calculating only the upper probability, specify the probability twice.
For example, let us determine the value of the horizontal axis at an upper probability of 2.5% of the t distribution with f = 8 degrees of freedom. (Figure 3)
[Figure 3]
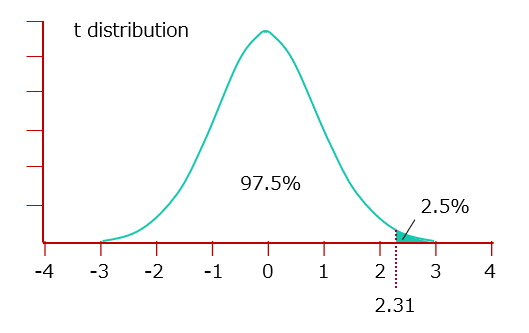
= TINV (0.025×2, 8)
= 2.31
>>Return to Tell Me About Statistics!

Comments are closed